The following sections explain Data Analysis Tabs and Data Analysis Tabs and Metric Data Views in more detail.
Data Analysis tabs contain tables and a series of displays called cards. See Card Reference and Common Table Features for details. On tables and cards, you can click to set a filter to limit data displayed across the interface, as described in Global Filters.
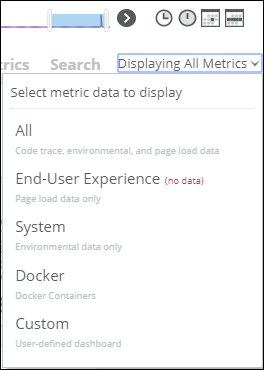
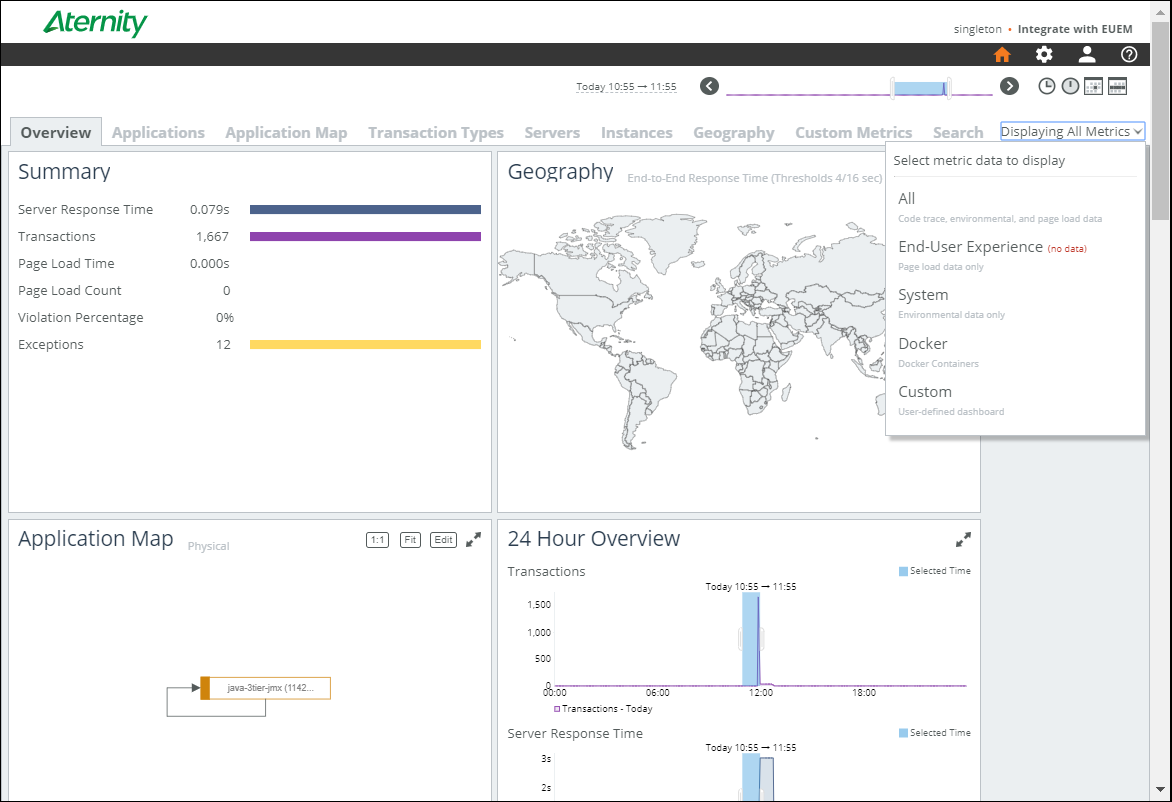
Time Range Settings apply to all tabs and include controls to compare two time ranges. “Data perspective” options limit the tabs and cards displayed to those relevant to the option (see ‘Perspectives’: Choosing Data to Display).
|
|
Overview Tab — Overall performance. Other tabs give more details.
|
|
|
Applications Tab —Performance details for any “applications” that administrators have defined. Application definitions specify transaction types, servers, and instances whose data APM groups together.
|
|
|
Application Map Tab—Interactive map of activity across multiple servers and tiers.
|
|
|
Transaction Types Tab—Performance details for important “transaction types”. Transaction types specify patterns that match a set of transactions you want to monitor as a group.
|
|
|
Servers Tab— Performance details for servers with the APM agent installed.
|
|
|
Instances Tab—Performance details for .NET or Java application instances for which administrators have enabled monitoring.
|
|
|
Geography Tab—Interactive map showing end-user performance based on the geographical location of users’ browsers.
|
|
|
Network Tab—Details on network activity visible to systems with the APM agent installed. This tab is available only with the Software as a Service (SaaS) offering of the analysis server (SteelCentral SaaS).
|
|
|
Processes Tab—Details of process activity on systems with the APM agent installed. This tab is available only with the Software as a Service (SaaS) offering of the analysis server (SteelCentral SaaS).
|
|
|
Custom Metrics Tab — Allows you to search for and display as a variety of charts and cards all the custom metrics that have been defined in AppInternals or that are gathered by the Custom Metrics REST API or the SDK, and allows the admin user to create custom dashboards.
|
|
|
Search Tab—Interface to create custom transaction searches based on a wide variety of criteria.
|